Stop the LiveCycle server instance.
In Adobe LiveCycle ES4 Service Pack 1, Process Reporting is installed as part of the LiveCycle Process Management module.
Process Reporting gives LiveCycle users the ability to query information about LiveCycle processes that are currently defined in the LiveCycle implementation. However, Process Reporting does not access data directly from the LiveCycle repository. The data is first published to the Process Reporting repository on a scheduled basis (by the ProcessDataPublisher & ProcessDataStorage services). The reports and queries in Process Reporting are then generated out of the Process Reporting data published to the repository.
This article details the steps to enable the publishing of LiveCycle data to the Process Reporting repository. After which, you will be able to use Process Reporting to run reports and queries. The article also covers the options available to configure the Process Reporting services.
Process Reporting Pre-requisites
Purge non-essential processes
If you are currently using LiveCycle Process Management, the LiveCycle database can potentially contain a large amount of data
The Process Reporting publishing services will publish all LiveCycle data currently available in the database. This implies, that if the database contains legacy data on which you do not want to run reports and queries, all of that data would also be published to the repository even though it is not required for reporting. You are recommended to purge this data before you run the services to publish the data to the Process Reporting repository. This will improve the performance of both the publisher service and the service that queries the data for reporting.
For details on purging LiveCycle process data, see Purging Process Data.
For the tips and tricks of Purge Utility, see Adobe Developer Connection article on Adobe LiveCycle: Purging processes and jobs.
Configuring Process Reporting services
Schedule process data publishing
The Process Reporting services publish data from the LiveCycle database to the Process Reporting repository on a scheduled basis.
This operation can be resource-intensive and can impact the performance of the LiveCycle servers. You are recommended to schedule this outside your LiveCycle server busy time-slots.
By default, the publishing of data is schedule to run every day at 2:00 am.
Perform the following steps to change the publishing schedule:
If you are running your LiveCycle implementation on a cluster, perform the following steps on each node of the cluster.
-
-
- (For Windows) Open the [JBoss root]/bin/run.conf.bat file in an editor.
- (For Linux, AIX and Solaris) [JBoss root]/bin/run.conf.sh file in an editor.
-
Add the JVM argument -Dreporting.publisher.cron = <expression>.
Example: The following cron expression causes Process Reporting to publish LiveCycle data to the Process Reporting repository every 5 hours:
- -Dreporting.publisher.cron = 0_0_0/5_*_*_?
-
Save and close the run.conf.bat file.
-
Restart the LiveCycle server instance.
-
Stop the LiveCycle server instance.
-
Log in to the WebSphere Administrative Console. In the navigation tree, click Servers > Application servers and then, in the right pane, click the server name.
-
Under Server Infrastructure, click Java and Process Management > Process Definition.
-
Under Additional Properties, click Java Virtual Machine.
In the Generic JVM arguments box, add the argument -Dreporting.publisher.cron = <expression>.
Example: The following cron expression causes Process Reporting to publish LiveCycle data to the Process Reporting repository every 5 hours:
- -Dreporting.publisher.cron = 0_0_0/5_*_*_?
- -Dreporting.publisher.cron = 0_0_0/5_*_*_?
-
Click Apply, click OK, and then click Save directly to the master configuration.
-
Restart the LiveCycle server instance.
-
Stop the LiveCycle server instance.
-
Log in to the WebLogic Administration Console. The default address of WebLogic Administration Console is http://[hostname]:[port]/console.
-
Under Change Center, click Lock & Edit.
-
Under Domain Structure, click Environment > Servers and, in the right pane, click the managed server name.
-
On the next screen, click the Configuration tab > Server Start tab.
-
In the Arguments box, add the JVM argument -Dreporting.publisher.cron = <expression>.
Example: The following cron expression causes Process Reporting to publish LiveCycle data to the Process Reporting repository every 5 hours:
-Dreporting.publisher.cron = 0_0_0/5_*_*_?
-
Click Save and then click Activate Changes.
-
Restart the LiveCycle server instance.


ProcessDataStorage service
The ProcessDataStorageProvider service receives process data from the ProcessDataPublisher service and saves the data to the Process Reporting repository.
At each publishing cycle, the data is saved to subfolders of a pre-defined root folder.
You can use the LiveCycle Administration console to configure the root (default: /content/reporting/pm) location and subfolder (default: /yyyy/mm/dd/hh/mi/ss) hierarchy format where the process data would be stored.
To configure the Process Reporting repository locations
-
Log in to LiveCycle Administration Console with administrator credentials. The default URL of LiveCycle Administration Console is http://[server]:[port]/adminui
-
Navigate to Home > Services > Applications and Services > Service Management and open the ProcessDataStorageProvider service.


RootFolder
The CRX location inside which the process data would be stored for reporting.
Default: /content/reporting/pm
Folder Hierarchy
The folder hierarchy inside which the process data would be stored based on the process creation time.
Default: /yyyy/mm/dd/hh/mi/ss
-
Click Save.
ReportConfiguration service
The ReportConfiguration service is used by Process Reporting for configuring the process reporting query service.
To configure the ReportingConfiguration service
-
Log in to Configuration Manager with CRX administrator credentials. The default URL of Configuration Manager is http://[server]:[port]/lc/system/console/configMgr
-
Open the ReportingConfiguration service.
-
Number of Records
When running a query on the repository, a result can potentially contain a large number of records. If the resultset is large, the query execution can consume server resources.
To handle large resultsets, the ReportConfiguration service splits the query processing into batches of records. This reduces the system load.
Default: 1000
CRX Storage Path
The CRX location inside which the process data is to be stored for reporting.
Default: /content/reporting/pm
Note:This is the same location as specified in the ProcessDataStorage configuration option Root Folder.
If you update the Root Folder option in the ProcessDataStorage configuration, you need to update the CRX Storage Path location in the ReportConfiguration service.
-
Click Save and close CQ Configuration Manager.
ProcessDataPublisher service
The ProcessDataPublisher service imports process data from the LiveCycle database and publishes the data to the ProcessDataStorageProvider service for storage.
To configure ProcessDataPublisher service
-
Log in to LiveCycle Administration Console with administrator credentials.
The default URL is http://[server]:port]/adminui/.
-
Navigate to Home > Services > Applications and Services > Service Management and open the ProcessDataPublisher service.


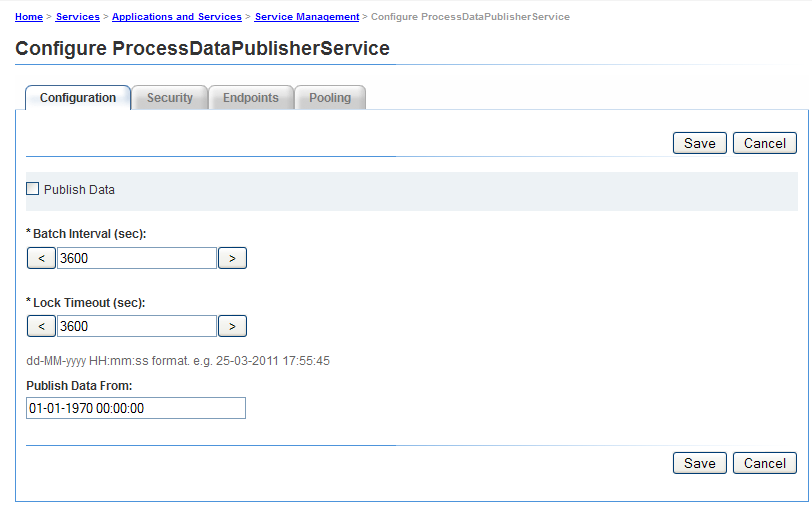
Publish Data
Enable this option to start publishing process data. By default, the option is disabled.
Enable Process Reporting only when all the configurations related to Process Reporting components are set up appropriately.
Alternatively, use this option to disable process data publishing when it is no longer required.
Default: Off
Batch Interval (sec)
Each time the ProcessDataPublisher service runs, the service first splits the time since the last run of the service by the Batch Interval. The service then processes each interval of LiveCycle data separately.
This helps in controlling the size of data the publisher processes end to end during each run (batch) within a cycle.
For example, if the publisher runs every day, then instead of processing the entire data for one day in a single run, by default, it splits the processing into 24 batches of one hour each.
Default: 3600
Unit: Seconds
Lock Timeout (sec)
The publisher service acquires a lock when it starts processing data so that multiple instances of the publisher do not start running and processing data simultaneously.
If a publisher service that has acquired a lock, is idle for the number of seconds defined by the Lock Timeout value, then its lock is released so that other publisher service instances can continue processing.
Default: 3600
Unit: Seconds
Publish Data From
LiveCycle environment contains data from the time that the environment was set up.
By default, the ProcessDataPublisher service imports all data from the LiveCycle database.
Depending on your reporting needs, if you plan to to run reports and queries on data after a certain date and time, it is recommended that you specify the date and time. The publishing service will then publish date from that time onwards.
Default: 01-01-1970 00:00:00
Format: dd-MM-yyyy HH:mm:ss
Accessing the Process Reporting user interface
The user interface for Process Reporting is browser-based.
After you have set up Process Reporting, you can start working with Process Reporting at the following location in your LiveCycle installation:
http://<server>:<port>/lc/pr
Log in to Process Reporting
When you navigate to the Process Reporting URL (http://<server>:<port>/lc/pr), the login screen is displayed.
Specify your credentials to log in to the Process Reporting module.
To log in to the Process Reporting user interface, you need the following LiveCycle permission:
PERM_PROCESS_REPORTING_USER


When you log in to Process Reporting, the Home screen displays.
Process Reporting Home screen


Process Reporting tree view:
The tree view on the left side of the Home screen contains the items for the Process Reporting modules.
The tree view consists of the following top-level items:
Reports:
This item contains the out-of-the-box reports that ship with Process Reporting.
For details on the pre-defined reports, see Pre-defined Reports in Process Reporting.
Adhoc Queries:
This item contains options to perform filter-based search for processes and tasks.
For details on ad-hoc queries, see Ad-hoc Queries in Process Reporting.
Custom:
The Custom node displays custom reports that you create.
For the procedure to create and display custom reports, see Custom Reports in Process Reporting.
Process Reporting title bar:
The Process Reporting title bar contains some generic options that you can use when working in the user interface.
Process Reporting title:
The Process Reporting title displays on the left corner of the title bar.
Click the title at any time to go back to the Home screen.
Last Update Time:
The process data is published from the LiveCycle database to the Process Reporting repository on a scheduled basis.
The Last Update Time displays the last date and time up to which the data updates were pushed to the Process Reporting repository.
For details on the data publishing service and how to schedule this service, see Schedule process data publishing in the article Getting Started with Process Reporting.
Process Reporting user:
The logged in user name displays to the right of the Last Update time.
Procces Reporting title bar drop-down list:
The drop-down list at the right corner of the Process Reporting title bar contains the following options:
- Sync: Synchronize the embedded Process Reporting repository with the LiveCycle database.
- Help: View the Help documentation on Process Reporting.
- Logout: Log out of Process Reporting