
Click any URL to navigate to the Request Details. On that page, there is a separate tab for GraphQL.
Last updated on
May 30, 2024
|
Also applies to ColdFusion
- ColdFusion Tools User Guide
- Performance Monitoring Toolset
- Overview of ColdFusion Performance Monitoring Toolset
- Auto-discovery of ColdFusion nodes and clusters
- Code profiler in ColdFusion Performance Monitoring Toolset
- Configure ColdFusion Performance Monitoring Toolset settings
- Install ColdFusion Performance Monitoring Toolset
- View cloud metrics
- Monitor GraphQL in Performance Monitoring Toolset
- Configure TLS/SSL and Authentication for Elasticsearch 8.x in Performance Monitoring Toolset
- View cluster and node metrics
- View data source metrics
- View external services
- View incoming services
- View list of sites and busy connections
- View topology of sites
- Datastore Health Monitoring
- Performance Monitoring Toolset Update 1
- Secure Performance Monitoring Toolset with HTTPS/SSL
- Performance Monitoring Toolset deployment guide
- Coldfusion API Manager
- Overview of Adobe ColdFusion API Manager
- Features in ColdFusion API Manager
- Get started with ColdFusion API Manager
- Install ColdFusion API Manager
- Authentication types
- Create and publish APIs
- Administrator
- Subscriber
- Throttling and rate limiting
- Notifications
- Connectors
- Set up cluster support
- Integrate ColdFusion and API Manager
- Metrics and Logging in API Manager
- Generate Swagger documents
- Configure SSL
- Known issues in this release
- Policies in ColdFusion API Manager
- Create a Redis cluster
- Multitenancy in API Manager
- Docker images for ColdFusion API Manager
Pre-requisites
Enable the following options:
- ColdFusion Monitoring must be enabled for the node.
- GraphQL monitoring in Settings > Node > Monitoring > Advanced > GraphQL monitoring.

Note
You must add the GraphQL Services and Clients added before enabling monitoring will appear in PMT after you restart ColdFusion, and make a request using the client.
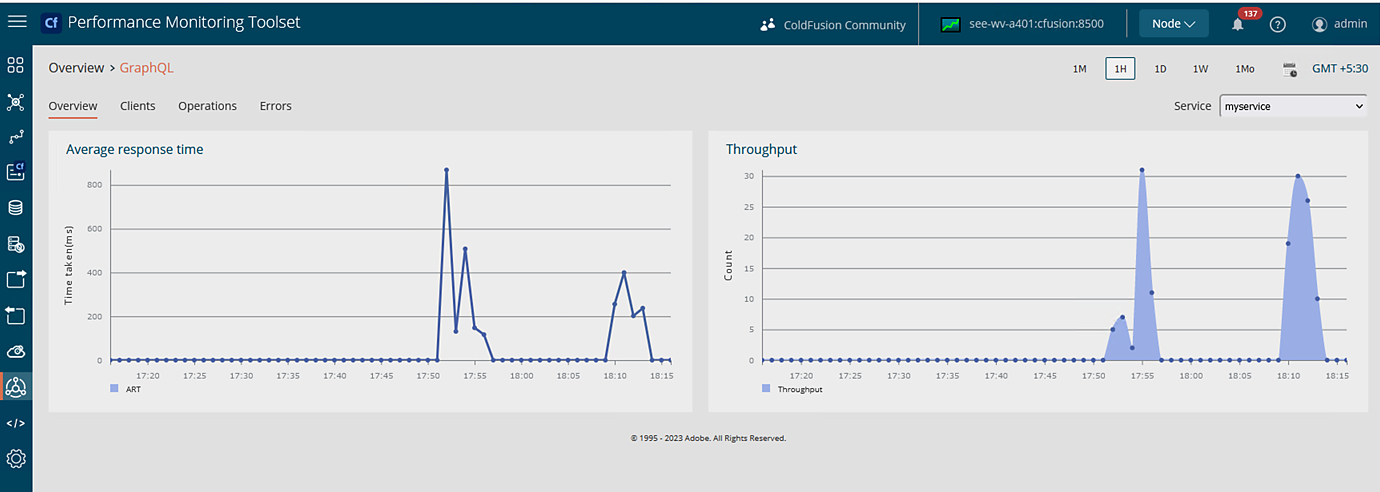
Overview page
This page lists the modifications to existing pages where you can view the GraphQL operations metrics.

Click any point on the graph to see a list of URLs that have been invoked at that instant.

To view GraphQL data,
-
-
To see threads that are spawned in async GraphQL calls, click the Threads tab.
-
See a list of all error calls.


Launch GraphQL Monitoring
-
On the left panel, click GraphQL
-
On clicking the GraphQl menu, a popup displays a list of all GraphQL services. Select the service that you want to see metrics for.
NoteThe pop-up for selecting a service comes for the first time only after PMT startup. If you need to switch between services, use the drop-down provided at the top right corner.
-
Selecting the service will take you to an overview page with metrics of that service. The Average Response Time (ART) and throughput of the service can be viewed here. Click on any point in the graph to list all the GraphQL operations responsible for ART at that instant.
-
Navigate to the Clients tab. The drop-down at top right shows all clients associated with this GraphQL service. This page shows the metrics of the selected client for the selected service.
Clicking on any graph again displays the list of operations executed by the selected client for the selected service.
-
Navigate to the Operations tab. You can see a list of the most frequent and the slowest operations executed for the selected service. By default, only five operations are displayed. You can modify the Count textbox to load more operations. The number of hits represents the number of times this operation was invoked. The Time taken is the average of all executions of these operations.


GraphQL execution
The GraphQL operations shown in the above list are clickable. Clicking on any operation displays the execution detail of that operation.


Each operation in the execution detail page is also clickable. If you click any execution here, a popup appears. It contains a detailed description of the execution of the GraphQL operation.

Errors tab
View a list of all erroneous GraphQL operations. The ART and throughput curve of erroneous operations is also shown here. All line graphs are clickable and will take you to the request-level detail page.
All operations in the table are also clickable and will take you to the execution detail page upon further clicks.

